 Fluxtrio
EV Motorway Range: Comparing 110, 130 and 150 km/h
Fluxtrio editorial team · Prepared and reviewed 16 October 2026
Summary
Higher speed raises aerodynamic demand: with unchanged air density, drag coefficient and frontal area, drag increases with the square of air-relative speed. That relationship does not make total EV consumption follow the same multiplier. A meaningful motorway comparison keeps the car, temperature and usable battery energy fixed while changing speed. N
Compare motorway scenarios in Fluxtrio. Try 110, 130 and 150 km/h as illustrative comparison settings where supported; these are planning inputs, not recommended speeds. Observe local limits and conditions.
What changes when speed increases?
The estimate considers the vehicle, battery health and charge, temperature, speed, driving style, payload and conditions. Cost includes charging losses and your tariff.
The following table is illustrative arithmetic, derived from that equation. It shows the aerodynamic component relative to the selected baseline. It is neither a car test nor a whole-vehicle consumption forecast. N
| Assumed speed (km/h) | Calculation relative to 110 km/h | Relative aerodynamic drag |
|---|---|---|
| 110 | (110 / 110)² | 1.00 |
| 130 | (130 / 110)² | 1.40, rounded |
| 150 | (150 / 110)² | 1.86, rounded |
Method: the speeds are editorially selected inputs; results are calculated from NASA's equation with constant air density, area and coefficient. The last column concerns drag alone. N
It would be incorrect to turn the last row into a claim that every EV uses that much more electricity or loses the corresponding fraction of its range. Fluxtrio's own model description treats consumption as dependent on the vehicle, driving scenario and temperature; aerodynamic demand is not the entire estimate. F
Why isn't aerodynamic drag the same as total consumption?
A vehicle's heating and other on-board systems consume energy too. Recurrent's winter research identifies cabin heating as an important winter demand, while EV Database explicitly separates heating and air-conditioning assumptions in its range scenarios. This is why temperature must remain visible when comparing speeds. R
For fixed usable energy, range is inversely proportional to consumption in the calculation documented by Fluxtrio. That is a different mathematical relationship from the drag equation. Do not use a drag multiplier as a range multiplier without a whole-vehicle energy model. M
Our editorial recommendation is to describe the trade-off in terms of your journey: what range does the estimate show at each speed, and does the difference alter your charging plan? Avoid choosing a headline percentage before choosing the vehicle and conditions.
What does “highway range” mean in a database?
EV Database defines highway estimates at a constant 110 km/h, cold as −10 °C with heating and mild as 23 °C without air conditioning. These are estimates rather than road measurements. E
Those estimates do not provide a measured result at a different speed. They also refer to that named vehicle generation and battery variant. Our recommendation is to check both the variant and the scenario definition before using any database figure as a reference. E
Is ADAC's winter route a constant-speed test?
No. ADAC replayed a recorded motorway journey with changes in speed and elevation. Its reference route covered 582 km, averaged 111 km/h, and used 130 km/h where no lower speed limit applied. The laboratory chamber was held at 0 °C. A
An average close to EV Database's chosen highway speed does not make the methodologies equivalent: one reproduces a varying route and the other defines a constant-speed estimate. They can inform different questions, but cannot isolate a speed penalty by subtracting one result from the other. A
See the winter test comparison for the implications when ranking cars, and winter range for temperature baselines.
How can you compare speeds in the calculator?
Select the same vehicle and keep battery state of health and charge window unchanged. Enter the expected temperature, then make separate motorway-speed comparisons. Fluxtrio documents speed, temperature, driving scenario and usable energy as parts of its estimate. F
Record the settings alongside the result. For a second pass, change temperature and repeat the speed comparison. This is a suggested comparison workflow, not a claim that we have executed those scenarios or measured their accuracy here.
If a desired setting is unavailable in the live interface, do not substitute a fabricated result. The verified link is the calculator homepage; this article does not assume a query-string format or an independently validated share-link preset.
Keep charging time separate from driving range. ADAC recommends comparing average charging power over a specified charge window rather than relying on peak power. A speed comparison by itself therefore cannot establish the quickest complete trip. C
Methodology and limits
The only calculated speed table here follows NASA's drag equation under explicitly fixed assumptions. No vehicle-specific speed-versus-range measurements or new Fluxtrio outputs are presented. The database and ADAC examples retain their different conditions. NA
For an energy-cost comparison, feed consumption and tariff assumptions into charging costs and losses. For a brochure comparison, use WLTP versus real-world range. Our recommendation is to choose a practical reserve before using any estimated range to plan a stop.
Compare your motorway settings in Fluxtrio, holding the vehicle and usable charge window fixed.
FAQ
Does faster driving always multiply total consumption by the drag ratio?
No. The squared-speed relationship describes aerodynamic drag with other terms fixed, not every energy demand in a vehicle. N
What speed does EV Database use for highway estimates?
The cited EV Database methodology assumes a constant 110 km/h for its highway figures. E
Was the ADAC winter test driven at a constant 130 km/h?
No. It replayed a recorded route averaging 111 km/h, using 130 km/h where no lower limit applied. A
Can range alone identify the fastest trip?
No. Charging performance also matters; ADAC compares charging curves and average power over a defined charge window. C
Sources
- N NASA Glenn, Drag Equation, updated 1 July 2025; formula and variable definitions. Accessed 16 October 2026.
- R Recurrent, Best EV for Winter & Cold Weather Range, 19 November 2025; cabin-heating explanation. Accessed 16 October 2026.
- E EV Database, Hyundai INSTER Standard Range; Real Range table and conditions. Accessed 16 October 2026.
- A ADAC, Winter-Stresstest, 22 January 2026; So haben wir getestet. Accessed 16 October 2026.
- C ADAC, E-Auto Schnellladen: Die besten Modelle für die Langstrecke, 18 March 2026; charging-curve discussion. Accessed 16 October 2026.
- F Fluxtrio, calculator and model explanation. Accessed 16 October 2026.
- M Fluxtrio, Metodika odhadu dojezdu (Czech); energy and consumption relationship. Accessed 16 October 2026.
Apply this to a specific vehicle
Set the conditions discussed above in the calculator. For your own comparison, use the sourced variants below (Czech); these are not claimed to match a cited test configuration: Volkswagen ID.3 Pro · Volkswagen ID.3 Pro S. Compare the full catalogue.
What the Fluxtrio model shows
The estimate considers the vehicle, battery health and charge, temperature, speed, driving style, payload and conditions. Cost includes charging losses and your tariff.
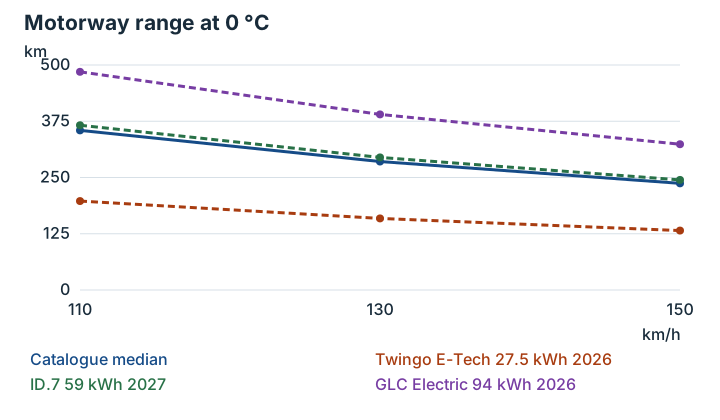
| km/h | Median range km | Range loss %: min / median / max |
|---|---|---|
| 110 | 354.7 | 0 / 0 / 0 |
| 130 | 285.5 | 19.5 / 19.5 / 19.5 |
| 150 | 237 | 33.2 / 33.2 / 33.2 |
Loss is relative to the same variant at 110 km/h, always at 0 °C. The median percentage is not a percentage calculated from median ranges.
The difference from mild weather or lower speed helps identify which input matters for your journey. It does not imply precision to a fraction of a kilometre. Repeated heating on short trips, the route profile and current wind can change the real result. Compare your own car with the same reserve rather than comparing someone else’s winter test with a summer catalogue figure.
Set up your journey in the calculator
- Open a specific variant in the calculator and check year, battery and standard. The preset uses 0 °C; replace it with your journey conditions.
- Set motorway speed and city share. Change one input at a time, then add occupants, luggage and weather.
- Enter documented SoH and your departure and arrival SOC. A full 100→0% window is for comparison; a journey needs a reserve.
- Enter energy price and currency and compare home and public tariffs. Save the shared link, then check the forecast and chargers before departure.
Next steps and related guides
Wheels, tyres and aerodynamics: how they affect EV range · Range methodology · EV charging curve basics · Buying a used EV: checking battery health · Home vs public charging: cost per 100 km · Winter range · Motorway speed · Heat pumps · WLTP and real range · Battery degradation · Winter charging and preconditioning
Vehicle examples from the catalogue (details in Czech): Renault Twingo E-Tech evolution, 60 kW, 27.5 kWh, 16" (2026) · Volkswagen ID.7 Limited Edition, 59 kWh, 19", 5 míst, NL (2027) · Mercedes-Benz GLC Electric 400 4MATIC, 94 kWh, 21", CH (2026). Open the calculator.
What real-world tests show
BMWBlog’s report on Bjørn Nyland’s test gives BMW iX3 ranges of 749 km at 90 km/h and 543 km at 120 km/h. InsideEVs’ report on his Ioniq 5 test gives 461 and 289 km at those speeds. These are different vehicles; the older Ioniq is not a current catalogue configuration. For the example ID.3 at 23 °C, Fluxtrio calculates a 90→120 km/h loss of 28.6%; the bounded speed factor also means percentage corrections are not universal across all speeds. Lower model sensitivity than these two tests does not establish accuracy.
Enhanced Auto’s Model Y test at approximately 30 °C reports 142.6 Wh/km at 110 km/h and 168.4 Wh/km at 130 km/h, with extrapolated range falling from about 554 to 469 km, described as just over 15%. Its Model 3 test at 14–20 °C reports 122.4 and 152.1 Wh/km and about 490 and 394 km. Fluxtrio calculates a 19.5% loss for this speed step at 0 °C: more pessimistic than the Model Y result, with a smaller difference from the Model 3 result. Conditions differ, so this does not establish agreement.
Enhanced Auto sells Tesla accessories. Each result is a single run; full-battery ranges are extrapolated from short runs starting around 60% SOC rather than driven to empty. The Model 3 article’s date is ambiguous in the supplied evidence (September/October 2026).
ADAC reports average consumption 57% above WLTP at 0 °C. Its methodology replays a recorded 582 km A9 profile in a climate chamber, averaging 111 km/h with sections at 130 km/h, rather than maintaining a constant speed. At constant 130 km/h and 0 °C, Fluxtrio’s published catalogue excluding estimated inputs gives median supply consumption 61% above catalogue WLTP, a larger penalty than the test. Different vehicles, speed profiles, charging losses and sample weighting prevent direct calibration. ADAC changed its procedure from January 2026; older Ecotest results cannot be pooled directly with the new procedure.
EV Database defines estimates at −10 °C with heating, 23 °C without air conditioning and 110 km/h for motorway driving. This is an estimation methodology, not another road test or independent validation of Fluxtrio. Plan with an arrival reserve and actual journey conditions.
Related guides
Wheels, tyres and aerodynamics · Calculation methodology · Winter range · Motorway speed
Sources & further reading
- NASA Glenn Research Center — Drag Equation | Glenn Research Center | NASA (2025-07-01).
- EV Database (ev-database.org) — EV Database - Real Range Estimation (example: Hyundai INSTER Standard Range).
- ADAC — Winter-Stresstest: Wie reisetauglich sind E-Autos für Familien? (2026-01-22).
- ADAC — E-Auto Schnellladen: Die besten Modelle für die Langstrecke 2026 (2026-03-18).
- Recurrent — Best EV for Winter & Cold Weather Range (2025-11-19).
- BMWBlog — The BMW iX3 Beat Its Own Range Record By Dropping To Smaller Wheels (2026-09-14).
- InsideEVs — Hyundai Ioniq 5 Achieves WLTP Range In Bjørn Nyland's Range Test (2021-07-31).
- Enhanced Auto (enhauto.com blog, author Stoyan Gyurov) — How Much Energy Does Your Tesla Use at Highway Speeds? (2026-09-16).
- Enhanced Auto (enhauto.com blog, author Stoyan Gyurov) — How Do Different Highway Speeds Affect Tesla Model 3's Consumption? (2026 (Sep/Oct; date ambiguous)).
- ADAC (press release) — Audi A6 Avant e-tron performance gewinnt Winter-Reichweitentest familientauglicher E-Autos (2026-01-22).
- Bjørn Nyland (YouTube) — Teslabjørn test results available on Google Drive (2020-03-13).