 Fluxtrio
EV charging curve basics
Fluxtrio ·
Start with energy and power
A kilowatt-hour (kWh) measures an amount of energy. A kilowatt (kW) measures the rate at which energy is transferred. Battery capacity is an energy figure; a charger’s rating is a power limit. For a first calculation, time in hours equals energy in kWh divided by average power in kW. The average over the whole charging window matters much more than the highest number briefly shown on the screen.
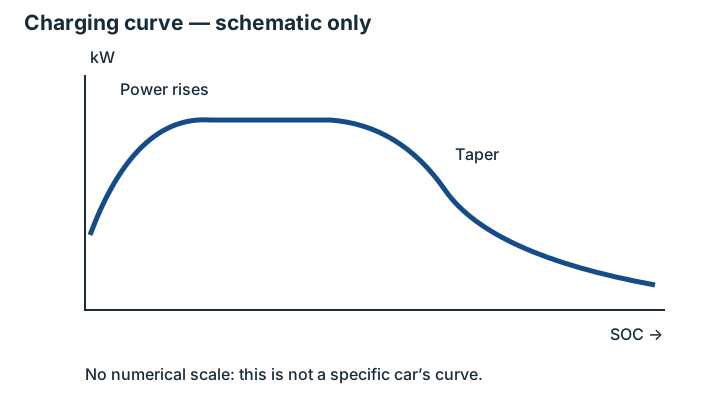
The charger’s advertised rating is only one ceiling. The car has its own limit, and its battery management system changes the permitted power as conditions change. A session may start below peak, rise, and then slow down. A peak figure in a specification therefore cannot predict a stop. You would need a documented curve for the particular battery, temperature and charge window.
Why do comparisons use 10–80%?
This window separates a substantial top-up on a journey from the slower finish near full charge. It is a comparison convention, rather than universal manufacturer advice or a guarantee of the quickest trip. At high state of charge, or SOC, the battery management system reduces charging power. That gradual reduction is called taper. Waiting for full charge can take longer than a shorter top-up if you can reach the next stop with a suitable reserve. If the next charger is far away, the energy needed for that leg takes priority.
Percentages are not an amount of energy on their own. The same window in a larger usable battery represents more kWh. Going from 10 to 80% spans 70 percentage points, so it adds 0.70 times the battery’s present usable capacity. An aged battery may store less energy in that window. It does not follow that its stop will be proportionally shorter: we do not know its power profile.
What the worked examples can tell you
The table uses only usable capacities and documented DC peak powers in Fluxtrio’s published vehicle records. Each row links to the variant and its source. We calculate an ideal lower bound by assuming peak power throughout the window and no losses. This is a mathematical reference, not a realistic charging-stop estimate. Do not turn it into a ranking for journey speed. We have not substituted an invented average for a missing charging curve.
Battery temperature and preconditioning
Battery temperature and outside temperature are different things. A cold pack may accept power more slowly. Preparing it before arrival can help it reach conditions in which the car permits higher power. The procedure is vehicle-specific: check whether preparation starts through built-in navigation to a charger, a manual control or another method. Entering an address into a phone app does not necessarily prepare the car.
Battery preparation also uses energy. Fluxtrio estimates driving consumption and range; it does not simulate a particular charging curve or predict preconditioning time. A stop plan therefore needs manufacturer information, charger availability and a reserve for adverse conditions alongside a range estimate. The drawing here explains the idea of a curve. It is explicitly schematic and does not belong to any vehicle.
For AC, check the onboard charger
During AC charging, the car’s onboard charger converts alternating current. The connection, wallbox, cable, available phases and onboard charger can each constrain power. A more powerful wallbox cannot automatically make the car charge faster. With DC, conversion takes place outside the car, so its AC onboard limit is not the relevant ceiling.
The current published records do not provide a usable maximum AC power field, so we do not calculate vehicle-specific AC durations. For your own rough estimate, divide the required supply energy by the actual average input power. Account for losses once, and allow for conditioning or cell balancing to change the result. Keep plugged-in time separate from energy-transfer time when comparing a charging offer.
| Variant / source | Usable kWh | DC peak kW | 10–80% energy kWh | Ideal lower bound min |
|---|---|---|---|---|
| BMW iX3 40 (2026) | 82.6 | 300 | 57.8 | 11.6 |
Simplified calculation: usable kWh × 0.70 / DC peak kW × 60. Constant peak power and zero losses are idealising assumptions; these data cannot establish a real stop duration.
Supporting reading: ADAC — charging losses and conditioning energy (already cited in the charging-cost article, accessed 2026-10-16). Check your car’s manual for its preparation procedure and limits.
Set up your journey in the calculator
- Open a specific variant in the calculator and check year, battery and standard. The preset uses 0 °C; replace it with your journey conditions.
- Set motorway speed and city share. Change one input at a time, then add occupants, luggage and weather.
- Enter documented SoH and your departure and arrival SOC. A full 100→0% window is for comparison; a journey needs a reserve.
- Enter energy price and currency and compare home and public tariffs. Save the shared link, then check the forecast and chargers before departure.
Next steps and related guides
Wheels, tyres and aerodynamics: how they affect EV range · Range methodology · EV charging curve basics · Buying a used EV: checking battery health · Home vs public charging: cost per 100 km · Winter range · Motorway speed · Heat pumps · WLTP and real range · Battery degradation · Winter charging and preconditioning
Vehicle examples from the catalogue (details in Czech): Renault Twingo E-Tech evolution, 60 kW, 27.5 kWh, 16" (2026) · Volkswagen ID.7 Limited Edition, 59 kWh, 19", 5 míst, NL (2027) · Mercedes-Benz GLC Electric 400 4MATIC, 94 kWh, 21", CH (2026). Open the calculator.
Related guides
Wheels, tyres and aerodynamics · Calculation methodology · Winter range · Motorway speed
Sources & further reading
- ADAC — Ladeverluste beim Elektroauto: So viel Strom geht beim Laden verloren (2026-08-06).